Time spent in apps grew just 6% last year, down from 11% in 2016

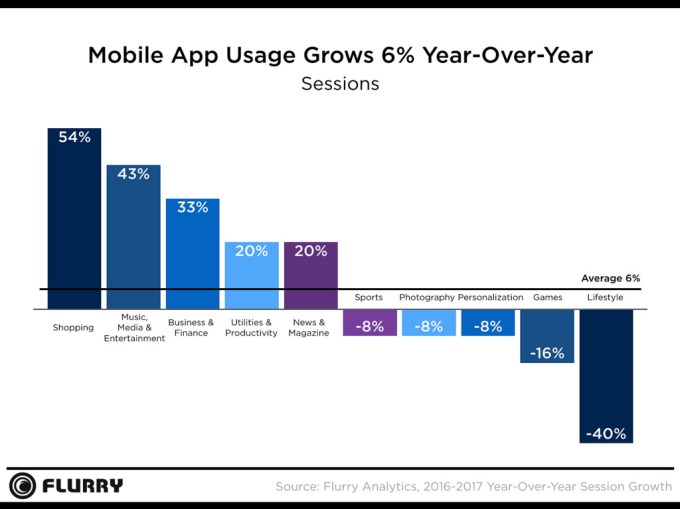
The app economy is continuing to grow, with the worldwide revenue from app stores expected to top $110 billion this year, according to recent estimates from App Annie. However, the time people spend using their apps is starting to stagnate, another report has found. In Flurry’s “State of Mobile 2017” annual wrap-up, the firm reported that overall app session activity only grew 6 percent from 2016 to 2017.
That’s down from the 11 percent growth it reported at year-end 2016, and represents users spending an average of more than five hours per day on smartphones.
The declining growth in session activity means users are reaching a point where they can’t give up much more time out of their day to using apps. Instead, they’re shifting activity from older apps to newer ones. They’re spending time across a diverse variety of apps, too.

There are some clear winners and losers in terms of app usage growth over the past year.
Not surprisingly, this has been the year for e-commerce to boom. Usage of shopping apps was up 54 percent from 2016 to 2017, Flurry found, now that consumers are comfortable making purchases paying on mobile devices. App integrations with Apple Pay and Samsung Pay have also helped.
We saw this trend play out in particular during the holiday shopping season where mobile shopping was set to pass desktop for the first time, for example, and where $2 billion of Black Friday’s $5.03 billion in online sales took place on mobile.
Another big winner in 2017 was the Media, Music and Entertainment category, which saw 43 percent year-over-year growth in app usage as consumers increased their media consumption on mobile.
This was also evidenced in a recent year-end report from Sensor Tower, which found that Netflix’s app generated the most revenue of any non-game app during 2017 – a position that Pandora had won for a quarter previously before being beat out for the overall top spot by Netflix.
App categories with declining in 2017 included Lifestyle and, surprisingly Gaming.
To be clear we’re talking about declines in app sessions’ growth, not declines in app usage here. It’s a metric that points to a larger trend related to apps’ usage and popularity, but not one that should worry developers and publishers just yet. After all, as Flurry points out, gamers today are spending more time and money in mobile games than ever before.
Lifestyle apps saw the largest decline in growth, down 40 percent year-over-year. This indicates the app category as a whole could be struggling to build daily usage habits, Flurry suggests.
To generate this report, Flurry tracked more than one million applications, across 2.6 billion devices globally in 2017. It defines app usage as a user opening an app and recording a session.
The full also report delves into other areas of mobile usage, including form factor adoption and top mobile manufacturers. Here it found that phablets are still heavily used, accounting for 55 percent of active devices.
Meanwhile, Android manufacturers made up two-thirds of all active devices in 2017, but Apple dominated individual market share with 34 percent of all active devices.
* Disclosure: Flurry shares a parent company with TechCrunch (Oath) by way of its 2014 acquisition by Yahoo. TC parent AOL merged with Yahoo to form Oath in 2017. Verizon owns Oath.