Unboxing Stitchfix’s S-1
![]()

When Zuiily went public in 2013, it sparked a resurgence of interest in an otherwise lagging e-commerce market. Quickly trading up to reach an $8B market cap — valuing the company at over 10 times revenues — Zulily became the poster child of the flash sales boom.
Over the ensuing months and years, concepts such as curated commerce, conversational commerce, flash sales, contextual commerce, digitally native vertical brands, subscription commerce and assisted commerce became a frequent part of the startup lexicon.
But of all those e-commerce segments, one stood head and shoulders above the rest: assisted commerce. And for one simple reason; as Amazon devoured an increasing amount of the online purchasing economy, their margin structure forced them to underinvest in human service.
This left a hole around verticals that demanded expert guidance through the purchasing funnel — a funnel which had often gotten harder to serve on mobile devices. Beneficiaries of this opportunity included both Stitch Fix and Trunk Club in apparel, and Havenly and Laurel & Wolf in furniture, for example. [I referenced additional reasons 18 months ago on TechCrunch in The Middleman Strikes Back.]
For consumer tech enthusiasts, Stitch Fix’s S1 represents the most exciting IPO since Snap and a rare peek under the covers of one of the most cash efficient e-commerce unicorns in history. It’s important to remember that S1 filings actually carry less data and detail than your average Series A fundraising deck, and Stitch Fix’s filing is possibly the least detailed prospectus I have ever read – so the document leaves us with more questions than answers. But there remain some fantastic insights which we’ll unpack below:
For the Love of Organic Growth
Stitch Fix may be the most cash efficient e-commerce marketing machine since the start of the modern Facebook marketing era. Here’s the punchline:
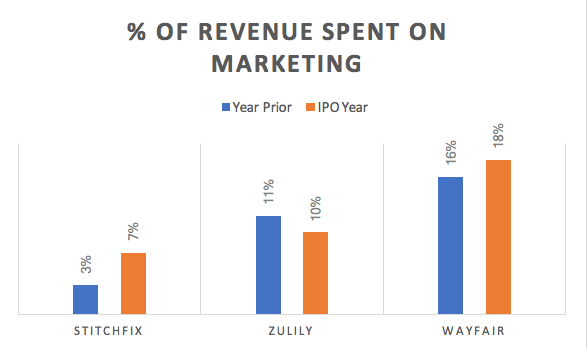
Stitch Fix’s numbers – especially for FY 2016 (and presumably prior) – are so far outside the normal distribution, that they look more like the growth of a viral social app than a commerce company. My personal guess is that Stitch Fix, with its differentiated & innovative experience, still saw much of its lift from Facebook – but built a secret sauce around Facebook’s tagging features, enabling them to leverage Facebook’s social graph for hyper growth, without being dependent on all of its costs.
However – as the novelty of Stitch Fix’s product offering has waned – that virality and customer excitement appears to be shifting to a more traditional marketing mix. Marketing costs nearly tripled in 2017, yet the company grew only 34%, meaning that each dollar became materially less efficient. That change in efficiency implies that they are facing headwinds in paid marketing for their first time ever. It also loosely confirms that Stitch Fix was leveraging a non-traditional channel for its early hyper growth and must now cultivate more traditional, sustainable marketing facilities.
The Company’s S1 intentionally obfuscates every other marketing metric an analyst might care for: the number of customers acquired annually, the average number of orders per year, even their customer acquisition cost. Nevertheless, we can make some rough assumptions:
The company tells us that they had 2.2M active, purchasing customers in the prior twelve months (2017), up from 1.675M active customers in 2016. However, they don’t give us any insight into churn or customer overlap from year to year. They do provide a somewhat ambiguous, but compelling statistic: that 86% of revenues in FY 2017 were driven by existing customers (meaning a customer who had purchased a fix somewhere between 2012-2016).
If that were the case, I’d estimate the company’s marketing mix as follows:
- 280,000 net new customers acquired in 2017 [1]
- Blended Customer Acquisition Cost of $280
- 2017 Cohort Payback: ~3 years [2]
The problem with the above analysis is that it treats any prior customer in the Company’s life as an existing customer, even one who had only ordered once five years prior. If we want to take a more generous approach and treat any customer – whether net new or re-activated from pre-2016 as a new customer – we can do so simply by subtracting their stated 2017 active customers less their stated 2016 active customers. It’s also reasonable to assume that some percentage of 2016 actives didn’t order in 2017 – we’ll use 30% as a placeholder. If that were the case, the company’s 2017 marketing mix would look something like this:
- 938,000 new customers + re-activations not active in 2016
- Blended Customer Acqusition Cost: $75
- Average 2017 Cohort Spend: $500 [3]
- 2017 Cohort Payback: <6 months [2]
It’s an imperfect science, but a 9 month payback for any business, especially one at Stich Fix’s scale would be extraordinary. I suspect the truth is somewhere in the middle – but anything under 18 months would still be very healthy of a business above a billion dollars in revenue.
But Slowing Growth
Stitch Fix is heading into its IPO as the slowest growing of any of its e-commerce peers:
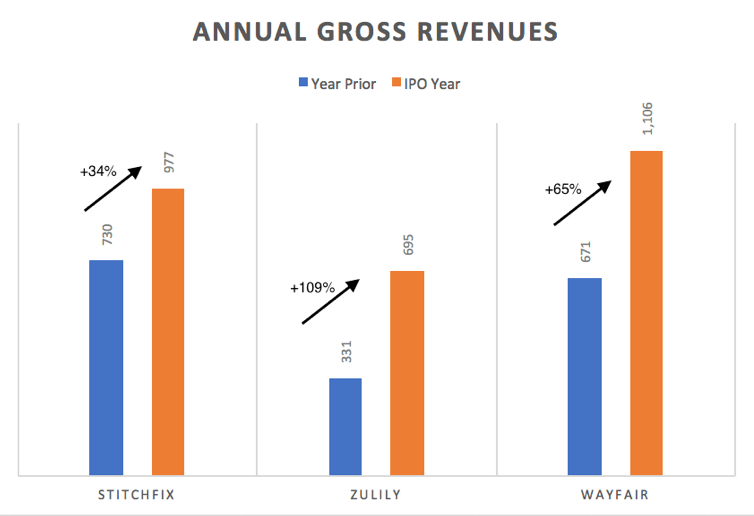
At the same time, as reflecting in the marketing section above, the Company has consciously elected profits over growth.
In a sense, growth is a bit of a vanity metric as it can be inflated unsustainably. Although Stitch Fix’s 2017 suggest it is battling rising marketing costs, the Company is making a bet that the public markets will reward deliberate, efficient growth over high burn hyper growth.
But Investors will need to decide whether these choices are due to prudent, careful operations or unsustainable, systemic customer acquisition conditions in more competitive categories such as men’s and plus size fashions. If the acquisition cost reality for a new paying customer is anywhere near our first estimation, then it would make me nervous of Stitch Fix’s economics in the short-term while they fight for market share in emerging categories against a variety of extremely well funded competitors [more below.]
Unit Economics
Assisted commerce is actually a rather complex business with multiple layers of costs, specifically:
- The cost of the product
- The cost of the experts (in this case stylists)
- The cost of logistics
What differs from traditional e-commerce are the costs related to: (a) the experts and (b) the return shipping. E-commerce companies typically experience a 20-25% return rate whereas assisted commerce companies are roughly around 80% – which makes sense given that they are sending you a variety of items and it only takes one unwanted piece to warrant a “return.”
That said, Stitch Fix’s filing again intentionally blends much of this data together, but we’ll do our best to peel the layers back.
Let’s start with their gross margins: Stitch Fix boasts 45% gross margins which is in line with traditional retail margins, but significantly lags mature e-commerce players, especially those that source extensively from independent merchants –[ normally between 55-65% gross margins.
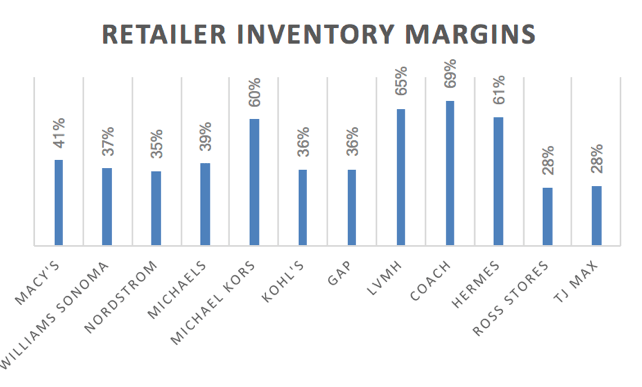
But Stitch Fix’s margin accountings are tricky – not purely inventory retail margins as they take into account the net effect of all shipping/return and re-stocking costs as well. As noted, these costs are higher for assisted commerce than traditional e-commerce because the percentage of (partially) returned fixes Is roughly 80%.
Now, again, Stitch Fix doesn’t report the costs behind their logistics or returns so there are two methods to estimate:
- The first is simply looking at other comparable companies. Shipping, returns materials, and re-stocking labor costs for most commerce companies is between $15-20 on a blended basis. Stitch Fix is a mature, scaled company and presumably deserves to exist on the lower end of that range.
- Many companies will offer a discount for keeping one’s entire shipment. It’s actually rather intuitive as a full keep actually offsets the return and re-stocking costs ($8-12) in addition to boosting average order values. A typical Fix has a $275 retail value (average of $55/item), so their 25% discount is contra revenue by ~$55 ($55 x 4 items x 25%) – likely ~$15 worth of contribution margin. Since they earn additional margin on the 5th and final item, this is a solid deal for the Company if it mitigates (or better) their return + re-stocking costs. It is also implies the return and re-stocking costs are somewhere in this range.
If we give Stitch Fix credit for the lower end of the logistics cost range – $15 – and make some simple assumptions around their ordering frequency, their inventory margins look something like:
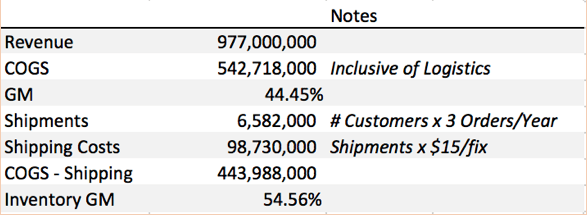
A 55% gross margin is really right where they should be for the category. Best in class would be 65%+, but if Stitch Fix is materially more popular than I’m guessing and the typical customer actually orders a fix 4 or even 5 times a year, then it’s margins range towards 60%+ and approach best in class.
Which leaves the final wildcard: how much does all that stylist labor cost?
The company buries and blends that information into their Selling, General & Administrative (SG&A) costs which is reasonable, though it would be nice to know how much leverage they’re getting from the gig economy. Stitch Fix Stylists – now 3,400 active – typically work part time and remotely and are paid on an hourly basis, $15/hour on average according to Glassdoor.
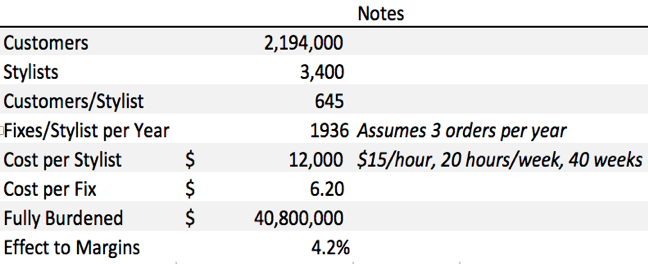
If this breakdown is correct, Stitch Fix would unequivocally be best in class and gaining a substantial amount of leverage from their stylist model, degrading net margins by only 4% in exchange for a substantial lift in customer loyalty, personalization and authenticity. To be honest, I suspect these estimates are low – but even if accurate – offer evidence of why this is a tough model for Amazon to emulate at scale, given that their net retail margins today hover around only 2%.
What’s Left Unsaid
Too much, unfortunately. The filing is coy if not cryptic. And while I’m sensitive to companies wanting privacy around their secrets, especially when the stakes versus Amazon are as high as they are, there are certain metrics that should be demanded by analysts when assessing the company.
- LTV:CAC Ratio – This should be fairly obvious, and although Stitch Fix tries to give us insight into their Lifetime Value analysis, it’s mostly useless without knowing true CAC, nor contribution margin.
- Keep Rate – This is the metric to track in the category, and has historically been difficult to move the needle on. It is calculated as [# of Items Kept by Customer / # of Items Sent in Fix,] Stitch Fix does show us evidence they’ve been able to lift this metric 22% in 2 years – but we don’t know from what base.
In my opinion, this number is doubly important for Stitch Fix, a company that has continually defined itself by its data science capabilities, under the leadership of Eric Colson, and frequent blogging on their website of their personalization algorithms.
That they don’t publish their keep rate is dumbfounding to me, especially because it could be done without revealing any trade secrets. Further, Stitch Fix is seeking a substantial multiple on its revenue, hoping to be valued as a technology company, not as a retailer. But with 3,400 stylists – which feels awkwardly similar to “store associates” at scale – it needs to prove that its data science is moving the needle in ways that others cannot copy. Data is a moat. People, unfortunately, in this case, are not.
- Breakdown by Category – This may seem high level and less than imperative, but in my opinion, could answer a lot of questions. In the past 24 months, Stitch Fix has launched products for men, plus size, petite and maternity. Each of these categories is a venture scale opportunity in its own right as evidenced by the relative scale of both Trunk Club (men) and Dia and Co (plus size).
Stitch Fix’s growth slowed materially in 2017 and marketing became significantly less efficient which is a bit surprising given that they actually increased in the number of niches they were able to target. Investors need to be able to see how these emerging categories are performing to better assess whether Stitch Fix will ultimately be a predominantly women’s service or whether they have a shot at running the table across all the assisted apparel categories from men’s to plus size.
My suspicion is that as Stich Fix has entered these new categories, they are for the first time facing headwinds in customer acquisition costs against Trunk Club (bankrolled by Nordstrom) and Dia & Co (backed by Sequoia’s deep pockets), whereas they scaled with relatively little friction within the women’s category. It’s a battle I don’t think the others will give up cheaply.
Parting Thoughts
A Professor of mine once observed that Amazon was the world’s first mega retailer to get to scale without making a boat load of profits along the way. And Stitch Fix, in that regard, looks like the anti Amazon, historically delivering strong EBITDA results and growing quickly on its own free cash flow.
The management, the investors, the employees and the board deserve credit for building an almost unprecedented business – possibly the most cash efficient e-commerce company of the decade and taking it from zero to a billion in revenue in only six years and less than $50M of paid in capital.
While I’m hopeful that Stitch Fix’s success will usher in a new wave of e-commerce investing and interest, a better outcome would be if it forced operators and investors across the board to more thoughtfully consider business models in an Amazon world and focus on building businesses that can deliver fundamental value where Amazon cannot.
Notes:
[1] Calculated by taking 2017 revenues * (1-86%), divided by 2016 1 year cohort spend (as a baseline). It is an imperfect analysis.
[2] Contribution margin should be defined as Gross Profit less the administrative costs for merchandising, customer service, stylists, content creation, and all order fulfillment. Unfortunately, we have no true indication of this number given that most of those costs are blended and buried into a broader SG&A. For the purposes of this analysis, and based on comparable administrative costs for peer companies plus the burden of stylist overhead, I have estimated contribution margin as 25%.
[3] Estimated at $500, slightly higher than 2016’s 1 year cohort spend given that 2017 6-month spend is trending slightly above 2016’s.
Featured Image: David Paul Morris/Bloomberg via Getty Images